Email: roizen@ix.netcom.com                                   References:  https://en.wikipedia.org/wiki/T/Maker     https://en.wikipedia.org/wiki/Peter_Roizen
My Other Idea: WildWords Crossword Game 
                   Here is a short book. Please read two chapters. I will make some outlandish claims I believe to be true.

 Download For Free       Click Here         New: Link for downloading examples available on that page.
 
This is Part 2                                                                      Return to Part 1     

The Lists Of Life

Sometimes a list lacking any serious calculation is among the most valued tables you have. Here is a list of bills similar to a longer one I keep for myself. There is a first trail that multiplies the frequency of a bill by a guesstimated average and puts that in a Total column. A second trail adds up that column of row totals. Because there are no calculations specific to a particular row, the data rows can be sorted without creating any issues. This list has a column used only to achieve a favorite order. It is possible to insert cloned rows with details included automatically underneath any row but the first. The first has responsibilities other rows do not. There is a column to mark paid bills or make a note. My note is often the amount of the last bill which usually suggests the guesstimate is old fashioned. Lines are added for easy reading. Below is a video displaying the details behind this simple but practical table.

Various Manipulations Including Cloning Data Rows From Another Row


Teaching With Interactive Tables

T/Maker has abilities to create tables with interactions between the user and the program. These could be a part of lessons, homework, or perhaps even tests. Learners must get comfortable with all the mechanics as well as solving the problems themselves. Practice and more practice are the best rules to ensure success.

You will see three problems later which could all be solved in one trail with multiple easy steps. Before playing the students part, you will see how the table is constructed. The student will be building the first trail. A second trail is used by the author to calculate the answers. It is disabled before the table is passed on to a student as a file. It could be removed completely, but the student might like to study it for more difficult problems. A third trail compares the correct answers to the results from the student's trail and marks each as an "Error" or "OK!"

It is not hard to build these exercises. I can see even producing examples with errors in them that the student must find. This could involve learning a useful but suspicious example, fixing it, and making corrections for other circumstances. The debugger would be a great CSI friend. With a regular spreadsheet, this idea would fall more under the category of DOA. All these tables can be saved and used again and again for different groups of students.

Example Video of a Simple Interactive Exercise

Loan Payments

I am putting this video here to avoid visitors quickly assuming T/Maker is only for children running lemonaide stands. You could add some lines for a host of other factors and seriously compare housing options. There is an example of this included. Basically input values (amount, number of periods, and interest rate) are put into specific memories. Then, based on those values, the MPY function puts the periodic payment into the calculator. Some converstions from yearly data to monthly periods are included by default. These correspond to the usual mortgage. But those calculations can be adjusted for other input data and other periods. The second column is an example for a loan with a payment made every two weeks.

Please stick around video showing mortgage / loan payment calculations.

A Painting Project (Everyone could work at this level)

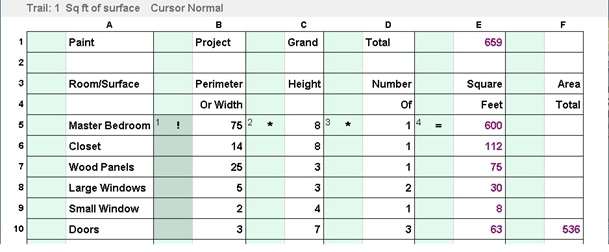
Here's a little painting project to figure out the square footage to paint so the correct amount of paint can be purchased. I decided to measure the perimeters of rooms to get the value for the full surface then subtract areas for doors or windows or whatever that would not need paint. You can see the one trail that is used throughout the table to convert dimensions and numbers of them into square feet.


In trail 2, I use sections of the trail to determine the totals by room. I add the full surfaces and subtract the areas not needing paint. I am using a feature to keep the first column always shown on the screen which is often helpful.


Finally, a third trail adds up the room totals to get a grand total at the top. There is a label not shown in the image but you can see the number. Now, let's imagine for a minute that the "T" in T/Maker stands for "Turkey" and let's talk that talk.

Point 1. Is there anybody who thinks this would be easier to do with a classic spreadsheet given how they work with cell names and hidden formulas? Would anybody rather do the task of inserting a few more rows with Excel? Maybe it's easy, but how can you be sure it is done correctly without checking some hard to read Bingo cards called formulas?

Point 2. Is there anybody who thinks that a hand calculator and a pencil is the better way to do this? Will that make it easier to adjust when something changes? How do you go back the next day to see if you remembered a particular this or that? And when you tire of the new color, where the heck is that piece of paper?

I think the answers are clear. There is a gap to be filled between "incredibly hard to use" and "not very useful at all." It is of primary importance that the easiest problems have the easiest solutions and a practical relevance. A new user needs to begin with an immediately understood and quick solution to something.

Making Important Choices

As you have seen above, there are multiple ways to make references to the values in the table. That opportunity is one of the freedoms in T/Maker that leads to an easy to understand trail versus a confusing formula. Like all freedoms it creates a responsibility to choose wisely. You have to get familiar with the choices.

To begin with, this can often be a trial and error process. You click in one approach and feel it's too messy or hard to follow. Then you grab the eraser, wipe it out, and click in another approach. That is extremely quick to do. You can even call up the debugger to check it works correctly.

A good choice may depend not only on the dynamics of how T/Maker works but on your personal preferences and aesthetic prioritites. Part of the fun is that your table also says something about yourself.

Click here for a video explaining stuff to know before writing your first trail

Best Practices

Needless to say, I have evolved some best practices over time. We will take a look at them. I searched online for a problem to use as an example. Below is the one I chose. It seemed it could happen in real life with the right person, in the right vehicle, during the right season, in the right state.

The Radiator Problem: A car radiator holds 10 quarts and is currently filled with a mixture containing 30% antifreeze. How much must be drained off and replaced with pure (100%) antifreeze to bring the mixture up to 50% antifreeze?  This is meant to be algebra with an X but I would start with calculating the resulting percentage from a number of quarts replaced. Going forward from the usual input to a result feels more natural than starting backwards and is instructive in any case.

The
Aproach: It is important to lay things out in a sensible space for your problem and the solution. I find it useful, especially with test questions I run across, to spend a minute thinking just about the units involved and their relationships. Here we have quarts of mixtures, quarts of pure antifreeze, and percentages of pure antifreeze in a mixture. A "cars built in a day by Bob" seems weird until you think of it as a speed like MPH. This observation can bring a sense of relief when these units are used on a test.

If there are key values you will control or are often needed, put them near the top.  Try to move down the table, left to right, calculating new items in the order they are needed with final results near the bottom. Don't worry about repeating yourself a bit. Notice that the Quarts Replaced will show up twice here -- once in the context of the number we want to enter and again in a section that calculates the new mixture of antifreeze from the two concentrations. These are very different usages justifying different locations. Don't cramp things. Put in the constants, but postpone going to the Trails screen until you have given the layout some thought. You can always change it.

Some Considerations: I would encourage you to do the math following a few principles. 1) Make a sincere and solid effort to avoid cell names. Use memories freely and pick names that are more like short words for a value held rather than abbreviatons which are difficult to remember.  2) Try to avoid putting two steps over the same cell. T/Maker is perfectly capable of handling that while allowing you to change any of the steps involved. But I look at each table as something like a painting and don't want to paint on top of any part of it. Since I am striving to do this in one trail for purely instructive purposes, I have to be more disciplined and tidy. That challenge can also be a source of satisfaction if you want to try to test what's possible.

Moving On To Trails: This image displays the steps in the trail in my solution. Be sure to always look at steps in a trail in their numbered order  (1,2,3,etc.). There are many other solutions including those with more trails and no memories. Let me spell out some of the principles here that I follow. For variables you will use in a number of steps, memories as mentioned above are a good choice. The names are not case sensitive, but you can mix case if that helps you in some way. BTW, you can go back and insert new steps, delete old ones, or make modifications in any step including changing its step number.

In this example, I have initially chose the Quarts Replaced and Total Quarts to be immediately put in memories. I have also put in two steps (3 & 4) to fill the Quarts column in the two line section devoted to establishing the antifreeze contributed by each component
. It is never too early to invoke the debugger. A strategy of a test even after small leaps of progress pays worthy dividends, because it is all in one area and fresh in your mind.

Steps 5 and 6 calculate the amounts of pure antifreeze contributed by each mixture. Sticking to my goal of only one trail,  I denoted the locations of some values by their column letter name and put the complete calculation in one cell. This is an example of how the freedom provided by trails versus formulas pays off nicely. Steps 7 through 10 finish the percentage calculation of the new mixture. Trial and error suggested replacing about 3 quarts which was close enough for practical purposes. This philosophy should probably not be used with prescription medicines. Please hang up and dial 911 if you are using this example for such a situation right now.

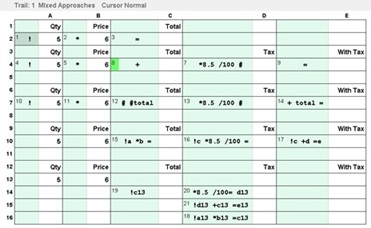
Built In Trial And Error: In the table to the right, I made use of the one above which calculates a new percentage for a number of quarts replaced. I inserted a step at the top to initialize some values and some steps at the end to check the situation and repeat the procedure as necessary.

Here's what's happening. The table starts off with a zero value for the quarts replaced. It then runs through the calculations. I added a line near the end of the table which holds the target percentage. The logic compares the percentage achieved with that target. If the last  step moved the needle closer to the target, I added one teaspoon of antifreeze to the amount to be replaced and repeated the calculations again. I doubt I could even do any filling to an accuracy of one teaspoon. Now if instead, I got further away from the target as opposed to closer, I stopped the process. I don't think this is hard to understand for someone familiar with the symbol/value syntax inluding the placement operators # or = followed by the designated location when not the adjacent white cell.


Binary Search: Finally, if I did intend to fill the radiator with a syringe... This final table performs a binary search for a value as accurate as you like. It starts with a high and low estimate, tries calculating with the average of the two, then changes the high or low estimate depending on the result until the difference between the two is less than a specified value. This is called a "binary search" because it cuts the range where the correct value may be in half with each pass. Because the process is stopped at some point, we can avoid Zeno's Paradox.

This technique and the previous one can be used with a variety of problems to find a precise solution. I doubt many would want to do that, but there are a lot of possibilites for adventurers and explorers.

Another use of iterations:
Risk / Reward Optimal Roulette Strategy Simulation


From My Own Life ....

The last table I created for myself was inspired by a worker for our supplier of electricity who changed our meter. The new one has a digital screen display and will record times of usage at various rates. I thought I would make a little table and monitor kilowatt hours used during various periods. It was only a few days bfore his visit I placed a portable AC unit and paneled over some skylights and hot windows. I would never make a spreadsheet to do this with cell names and algebraic formulas. Not worth the hassle.

I figured I would do it nicely and put it with the examples. To the right is the table on the Data screen.


Below is the first trail. I decided to measure time in terms of decimal hours elapsed and settled on a military clock to denote the hour. This trail converts a Day/Hour/Minute time to an elapsed hours from time zero. The minutes are converted into decimal hours then a sum is created of the Days times 24, plus the Hour, plus the decimal part of an hour for the minutes and that is placed in column D.


The second trail is where things got interesting. I wanted to calculate the elapsed time between two readings and the kilowatts used for that period so I could produce a consumption rate for a day. A daily rate seemed intuitive to me. That was fine and dandy, but then I realized I had not created a column to add up either of these numbers to determine an overall average. I thought this trail would be the place to do it since it calculates the necessary values one row at a time.

My first inclination was to add more operators to the steps already there. Lengthy steps prohibit the easiest reading of what is going on, so I am not fond of them. What suddenly struck me was that the additional calculations involved could use just memories and operators. I just had to make sure the elapsed time and used KWH were put in memories. Then I could put the needed steps anywhere in the table -- even in cell Z486 if I so desired!

Well, I did not travel that far away, but you can see I dropped the steps into a vacant area where they would not interfere with cloning rows. Cloning rows can lead to the unintended duplicating of steps carelessly placed. I added the accumulating calculations in the most intuitive way possible -- one operator per step. This approach kept every step of the trail fully visible on the screen.

The final trail spilled out the needed totals and calculated the overall day rate. The video runs through a few applications for each trail with the debugger and begins by cloning a row at the data screen level. In the debugger the cell box associated in trail 2 for steps 7 though 12 step will continue to jump around when the second trail is reapplied, but the math never uses the adjacent cell. It is of no consequence.

I think T/Maker's fundamental design and display with the incredible debugging tool makes other spreadsheets feel like working in a thick fog with sunglasses and a flashlight. There are plenty of perfectly valid reasons people have to use Excel, but those who share none of them should have another choice.

Click here for the walk about with the debugger.

The Next Day: I went back to add a column for a monthly charge assuming the daily rate was maintained for 30 days. I did this on my own table, so the data below does not correspond with the screens above but the trails above remain the same. For my new trail I decided to start right out emphasizing the place to put the steps.

The first st
ep which put the rate in memory and the last step which output the cost would need a proper location based on the row being calculated. If I did all the other steps with only constants and memories, they could go anywhere.

I decided to just go down the one column with steps that each accomplished something meaningful yet not too much. BUT, since I want to clone rows from a row above them, I do not want steps to get cloned in the process. Thus I put the new steps below the Total line. If they were in the darkened green area, cloning would draw a warning. The error would be obvious and easy to correct. However, this way looks more like the perfect solution which it is. 

My bill has a rate for a first allotment of 14.5 KWH times the number of days in the bill ($0.41). Anything over that has an even higher rate ($0.45). Also there is a fixed cost of $19 added to the bill. I think the steps need no further explanation. The Steps box makes for an easier reading of the steps when they are long. This is, for the record, a programmed algorithm and not a formula.

Two Days Later: I noticed that I sometimes create trails that have some steps in unfortunate locations. That's either because of cloning or a need to delete rows now and then. Some screen areas may be best left without any steps located in them. Also, once a trail is working correctly, it might be useful to put it at the very top or bottom. Well here is a capability below that I added. Remember wherever the steps may be, Step 1 will always begin at the dark green cells designated. As the developer of this thing, it is a source of fun to try to add features that improve issues which only T/Maker could have.

The New Facility


IRA's: Traditional versus Roth

You would need a lot of unobtainable numbers to do this perfectly, but a simple table may help you decide. The choice is not about escaping taxes. It's about when you pay them and what you pay them on. Get it over with now (Roth). Or forget it now and pay later (Traditional).
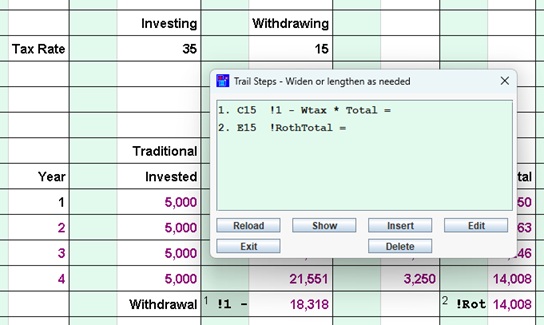
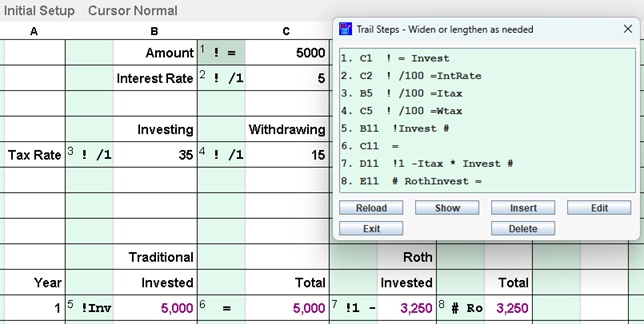
Our first trail is used to store some key numbers in memories and setup a first row. We will advance in time year by year moving down the table with one row for each year. The first four steps establish the amount dedicated to an investment each year and rate multipliers (from percentages) for the  return on our investments, our tax rate while investing, and the tax rate when withdrawing.


For the traditional IRA the money we invest escapes all taxes so our $5,000 goes directly into our account. See columns B and C on the bottom row of the table. In the Roth case we entered a tax of 35% which is applied first and which leaves us only $3,250 to deposit.

Our second trail does the year by year calculations. First we add 1 to the count of years (steps 1 and 2). Next we set this year's investment (step 3). Then we add 1 to the interest rate for our return and mutiply that by last year's total in the table to add in the new interest on that (step 4). Finally we add this year's investment, put the new total in a memory named Total and display it in the table.

Steps 6, 7, and 8 do for the Roth case what 3, 4, and 5 did for the Traditional case. It looks a little busy here but when this was specified and run through with the debugger every few operators, it was pretty straightforward.

Finally we need to show what we get as a total amount when withdrawing portions of it at the withdrawal tax rate. This only applies to the Traditional IRA. The taxes for the Roth IRA were paid before the deposits were made.
This is not a super accurate calculation. However, it you play with the investing and withdrawing tax rates, you will get a picture of how the two plans perform. My guess would be that the Traditional approach is generally quite a bit better with the typical situation of having a higher income while working and and a much lower income when retired. Of course, others may have made better plans.

A video of the debugger stepping through this table for a few rows.


Sort Of Ridiculous
These two videos as the above title suggests have nothing to admire in them or to learn from them.
1) The first video takes 24 data numbers and derives 96 results with two simple trails. I am not a fan of adding foolish rows, but it shows how easy that can be.
2) The second video with sound is longer. It demonstrates that even the simplest problem justifies starting out with T/Maker. Not only is T/Maker incredibly
  easy, but you never know when something might get more complicated or be worth keeping around for a future reference or correction.

Forms

With four different line styles plus the possibility of no line, you can design some nice forms. Allow text to span multiple columns when setting formats (Alignment "+" Spans). Text can be specified in an invisible ink format effectively blanking it out. This is useful when elements in a table are needed for calculations but not desired in a final print-out. A respectably looking result is achievable with some experience.

Printing

Print the table in one of four fonts. Choose font style and size. Set a row height to tighten or spread out the vertical dimension. Decide whether or not to print lines. Options are available for row names and column names. Switch between landscape and portrait as well as set margins with two system dialog boxes called up with a button.


The top of the page shows the length and width of your table in pages. In addition to marign adjustments, changing the size of the font and other items may affect these numbers. Use the Recalculate button to refigure the size when you have altered any items. I generally try for a minimum number of pages with the width of only a single page.


An Important Caveat

In software, this apetizingly sounding word usually implies a logical flaw or inconsistency that can only be solved by something more annoying. It can, however, often be circumnavigated.  No one wants two ships passing in the night to arrive at the same spot at the same time and collide with each other. In T/Maker this spot is marked not with an X but with a minus sign.  Minus signs (i.e. dashes) in trails are always assumed to indicate an upcoming subtraction. But the symbol itself is capable of prefixing a number to make that number negative. To know which is which, an underscore character must be used in T/Maker trails when the intention is a prefix. In the white cells, no operators are specified so a minus sign could only be a prefix. See how the different cases above are parsed in the video below. It's all about the value used with the second operator. Is it the adjacent cell or the number following?

BTW, It was the 18th century mathematician, Jean Louis LeFait IV, who first said speaking in French, "You can't have your caveat and eat it too."

A video of which is which

Statistics

Algebra is often a prerequisite for a number of subjects. Some teachers may be thinking that a knowledge of it is necessary to calculate and understand the topic. But T/Maker changes that. A single ampersand cursor running down a column can yield a number of measures for the values included. The difference between the mean and median is "must know" material.

Trails have been added here to normalize the data and step up to calculating the correlation coefficients.  You can see the temperaturs scales of Fahrenheit and Centigrade produce the maximum possible value on one. A little explanation of what that coefficient impies could be interesting. And the zero correlation (not shown) between the sine and cosine or easier examples (the same curve but out of phase) might suggest suggest the statistic is not as clever as it can appear to be. Interesting oservations are fun. With the pressure off to become an expert, a basic understanding of stuff can be attractive. Geometry and probabilites were introduced above. Imagine a course with a new topic covered every week and where T/Maker sits on every desk to do the supporting math live.

Wouldn't that be cool?


One Of Many Little Things

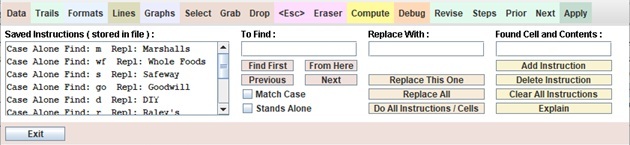
Like other sorts of of software, T/Maker has a box/tool for finding and replacing text in a table. As usual, a feature that would be useful in my own household seems never to be found in such a box. That feature would be to store find-and-replace commands in the file. In the case at hand, it would be able to replace abbreviations with their full spellings for frequently included line items in an invoice   When a new invoice is needed the previous one with the stored replacements could be loaded and renamed, or a custom template could be made to use at the start.

A Video Of The Find/Replace Box In Action

When and Tally

To do a demonstration here I typed in some names and used the random number generator to get a number between 45 and 94 for each name.

A When-clause is a logical test with two values. If the test is in a step and true, executing the following instructions in that step continues normally. If the test is false, other instructions in the step are skipped over. T/Maker proeeds to the next step. The instruction after a when-clause might, however, be for T/Maker to start doing something else as with RESTART or EXTRAIL. The when-clause offers opportunities to treat different circumstances with different operations.

The screen shown can be obtained by requesting it in the Trail Helpers menu. You use this helper by proceeding left to right through the three list boxes. First you pick the type of value you want to start with, then the test requested, and then the second value to use in the test. As you do this, a corresponding when clause is built in the edit field below. T/Maker does not build the exact test. Rather it builds a model of it based on what you indicated. In the example shown a value from another column was requested along with a less than operator and a constant number. T/Maker offered up a single letter column name for the first value and a place in the line to put the number you want. If you wanted colunn C instead of B and your number was 101, you would edit the proposed line accordingly. When that is done you can push a button to have the script put in the clipboard and attached to the cursor. Now you can click or paste it into one or more steps.

BUT......!  You can instead push the Tally Table button. If you do that T/Maker will run through your rows and count the number of lines for which the test is true. It will also highlight those lines. Where you go from there is your business. Because the script is not associated with a cell in this type of usage, you will end up using the cell's column name to designate the value needed. In the video below, T/Maker will determine the number of rows with a value less than 60 and the number of names with a capital M. When-clauses put in steps can do a lot more but this is lickety split if you have a sudden curiousity. There is a item in the Misc menu to clear out the highlights.

A video of using Tally twice


Graphics

While the charts and graphs in T/Maker are not on a par with well-established spreadsheets, you can use them to get insights into your data and a student can learn what type of chart best illustrates a certain point. This is one of a number of areas where T/Maker could be improved by teaming up with a company that already has a professional collection of charts and graphs. The current graph interface could be kept pretty much as is in terms of simplicity. Better to forgo a few capabilities then start to make things complicated.


Importing / Exporting Data

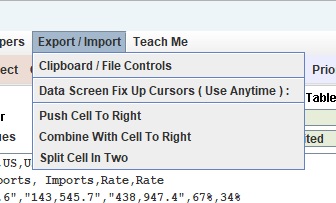
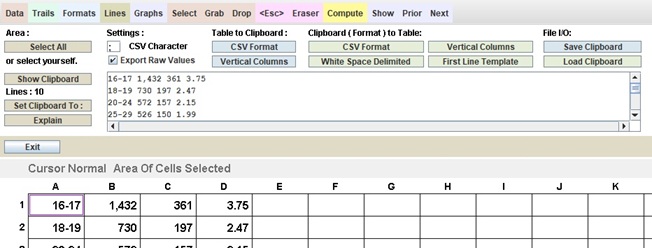
Moving data into T/Maker from another program or moving it out of T/Maker to another program can serve many purposes. There is a menu item for precisely that which offers flexibility and is easy to use. To the right, the menu for these operations is expanded. The first item brings up the associated helper screen below.  The clipboard plays a central role in in importing and exporting. When importing you can load the clipboard from a file on disk or use the copy keystroke or menu item to copy a selected area from wherever. Next you can show the clipboard and examine or change its contents. You might even add a template indicating where the data is horizontally! After selecting an upper lefthand corner in your T/Maker table to accept the data, you can push a button to make the transfer assuming a given format. You will choose from a number of options.

When importing data from a web page or informal file, you will rarely get a perfect result. From web pages you will sometimes get a completely useless result. But on occasion you will get one that is not great but not terrible either. The bottom three menu items bring up special cursors that can make adjustments to a cell they are clicked over. These adjustments are meant to fix typical problems that may have occured. The cursors can be used for any purpose as long as you are on the Data screen.

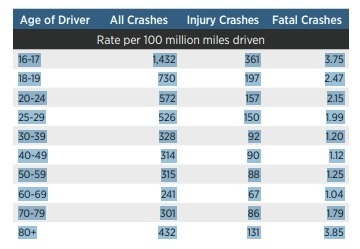
The data in the clipboard below was gotten by copying the selected area from the web page shown to the right. It was then loaded into the cells beneath it using the Clipboard To Table button for the White Space Delimited format. This was a lucky case where the html in the webpage had been written in a very simple manner.


Here is a related tutorial video showing data being exported then imported to the location it had in the first place.


Additional Touches

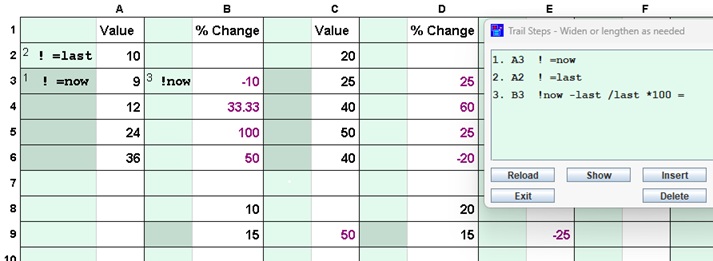
In many tables of data you may wish to add an extra column or row derived from the data itself. In the table to the right, a % Change column is calculated from a "current value" and a "previous value" above it. The new value  is placed to the right of the current value.

The calculation is applied going down two columns. The trail is also used in a few other spots to demonstrate it can be used anywhere in the table where the positioning of the data and the result are consistent with its expectations.
A box showing all the steps in a trail is a handy feature especially when steps are long and there are many of them.

I suppose a more mathematical name for this ability would be a "function." It could draw and place data using memories instead of locations. Indeed T/Maker functions like a mortgage payment or net present value work in exactly that way. They expect relevant values in prescribed memories and leave the calculated result in the calculator window. A collection of statistics for a column of values can be created with the combo operator, the ampersand &. A variety of values are placed in particular memory names for fetching and displaying as needed. An example of this is further down this page.


Out Of Order

Steps 1 through 4 in this table calculate a Miles driven and a Miles Per Gallon. The problem is it calculates the latter before it calculates the former. While a mistake like this in one trail is unlikely, a similar problem could occur across a number of trails. Say trail 3 uses a value that is not calculated until trail 7. You could push the Compute button a second time and all would all would gnerally be fine. But you can also put instructions in the table to make multiple passes.

For a first pass T/Maker starts with all memories set to zero. But it does not reset them to zero when subsequent passes are made. That makes it easy to count the passes in a memory (Step 5. "pn" is a memory for "pass number") and take action based on that (Step 6. The table is restarted if only one pass has been done). Normally these steps would be put in the their own trail -- the last one of the table. That would allow inserting other trails ahead of it without any issue. There are some situations where passes are made until a goal is achieved.

If you look at the video of the Debugger running through this table, you will see that the MPG is set to zero the first pass, but corrected on the second.

Watch The Debug Video (39 seconds)


Return to Part 1


More material coming........